if (!requireNamespace("pak", quietly = TRUE)) install.packages("pak")
if (!requireNamespace("InsightNetApr26", quietly = TRUE)) {
  pak::pkg_install("cmu-delphi/InsightNet-apr-2026/InsightNetApr26")
}
InsightNetApr26::verify_setup()

# If pak demands Rtools and you don't have it, you can use this instead:
#
# if (!requireNamespace("remotes", quietly = TRUE)) {
# install.packages("remotes")
# }
# remotes::install_github("cmu-delphi/InsightNet-apr-2026/InsightNetApr26")
# remotes::install_github("cmu-delphi/epidatr")
# remotes::install_github("cmu-delphi/epidatasets")
# remotes::install_github("cmu-delphi/epiprocess")
# remotes::install_github("cmu-delphi/epipredict")

library(epidatr)
library(epiprocess)MINI-PROJECT 1: Finding indicators and fetching data
Introduction
This notebook covers the first mini-project, focusing on finding indicators and fetching data through the Delphi Epidata API.
Load packages
{InsightNetApr26} package ensures all required Delphi tools and their correct versions/branches are installed.
Finding Indicators
You can explore available indicators in the Delphi Epidata API documentation. For this example, we’ll use the “Doctor visits CLI” indicator.
Fetching Data
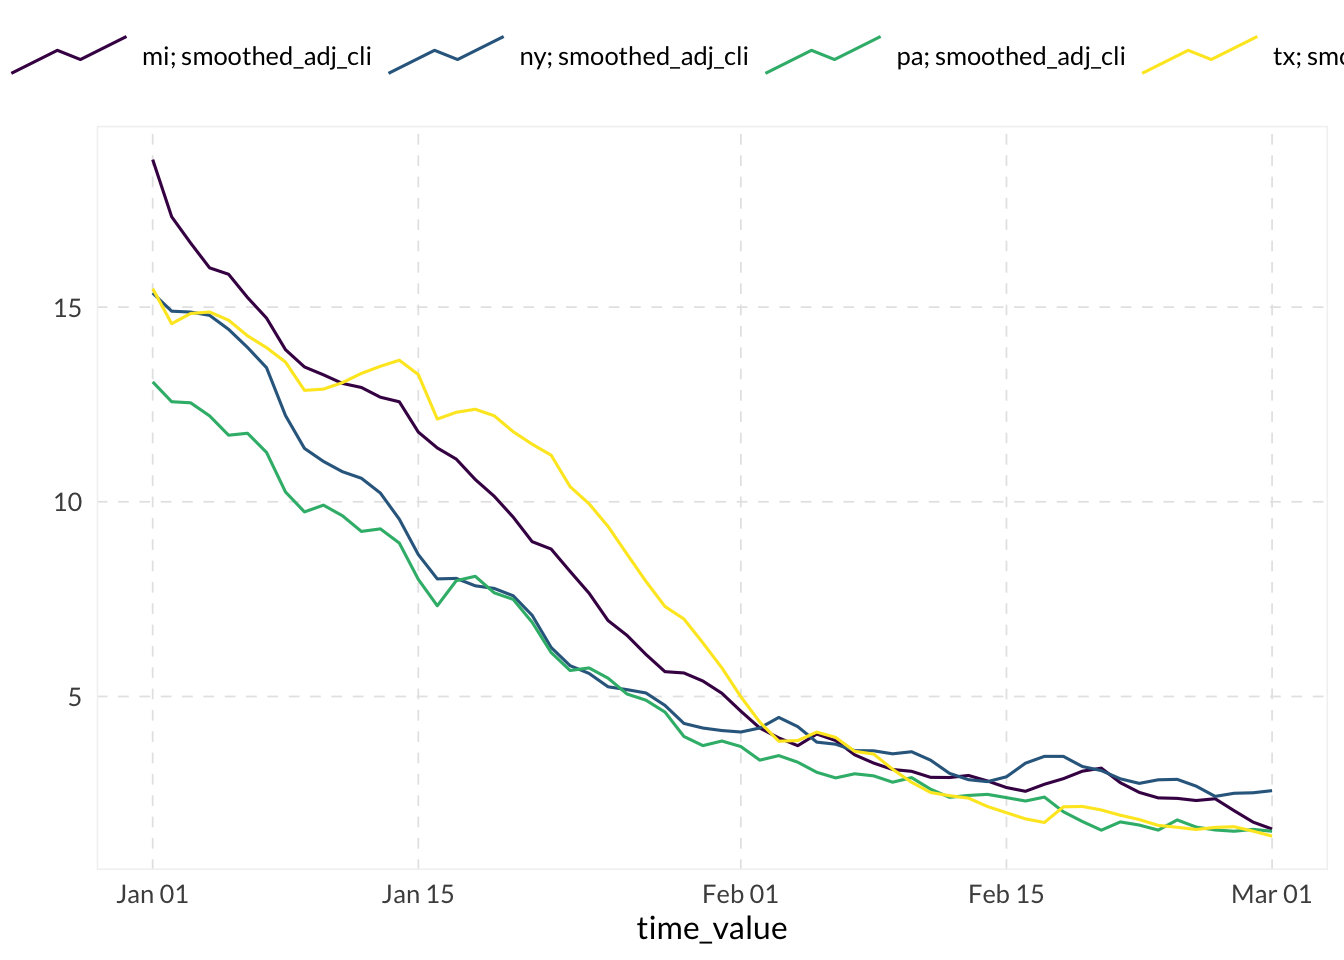
We’ll fetch the smoothed_adj_cli signal from the doctor-visits source for selected states over a specific time range.
res <- pub_covidcast(
  source = "doctor-visits",
  signal = "smoothed_adj_cli",
  geo_type = "state",
  time_type = "day",
  geo_values = c("mi", "ny", "tx", "pa"),
  time_values = epirange(20220101, 20220301)
)
Processing and Visualization
We convert the raw API response into an epi_df for easier analysis and plotting.
# Convert the data into epi_df format
edf <- as_epi_df(res)

# Show description + head of the resulting epi_df
edf
An `epi_df` object, 240 x 15 with metadata:
* geo_type = state
* time_type = day
* other_keys = signal
* as_of = 2022-05-11
Latency (time between last available observation and epi_df's as_of, by time series):
* latency = 71 days
* Empty time series detected
# A tibble: 240 × 15
geo_value signal time_value source geo_type time_type direction issue
* <chr> <chr> <date> <chr> <fct> <fct> <dbl> <date>
1 mi smoothed… 2022-01-01 docto… state day NA 2022-03-15
2 ny smoothed… 2022-01-01 docto… state day NA 2022-03-15
3 pa smoothed… 2022-01-01 docto… state day NA 2022-03-15
4 tx smoothed… 2022-01-01 docto… state day NA 2022-03-15
5 mi smoothed… 2022-01-02 docto… state day NA 2022-03-16
6 ny smoothed… 2022-01-02 docto… state day NA 2022-03-16
7 pa smoothed… 2022-01-02 docto… state day NA 2022-03-16
8 tx smoothed… 2022-01-02 docto… state day NA 2022-03-16
9 mi smoothed… 2022-01-03 docto… state day NA 2022-03-17
10 ny smoothed… 2022-01-03 docto… state day NA 2022-03-17
# ℹ 230 more rows
# ℹ 7 more variables: lag <dbl>, missing_value <dbl>, missing_stderr <dbl>,
# missing_sample_size <dbl>, value <dbl>, stderr <dbl>, sample_size <dbl># Quickly plot the data using epiprocess::autoplot
autoplot(edf, value)