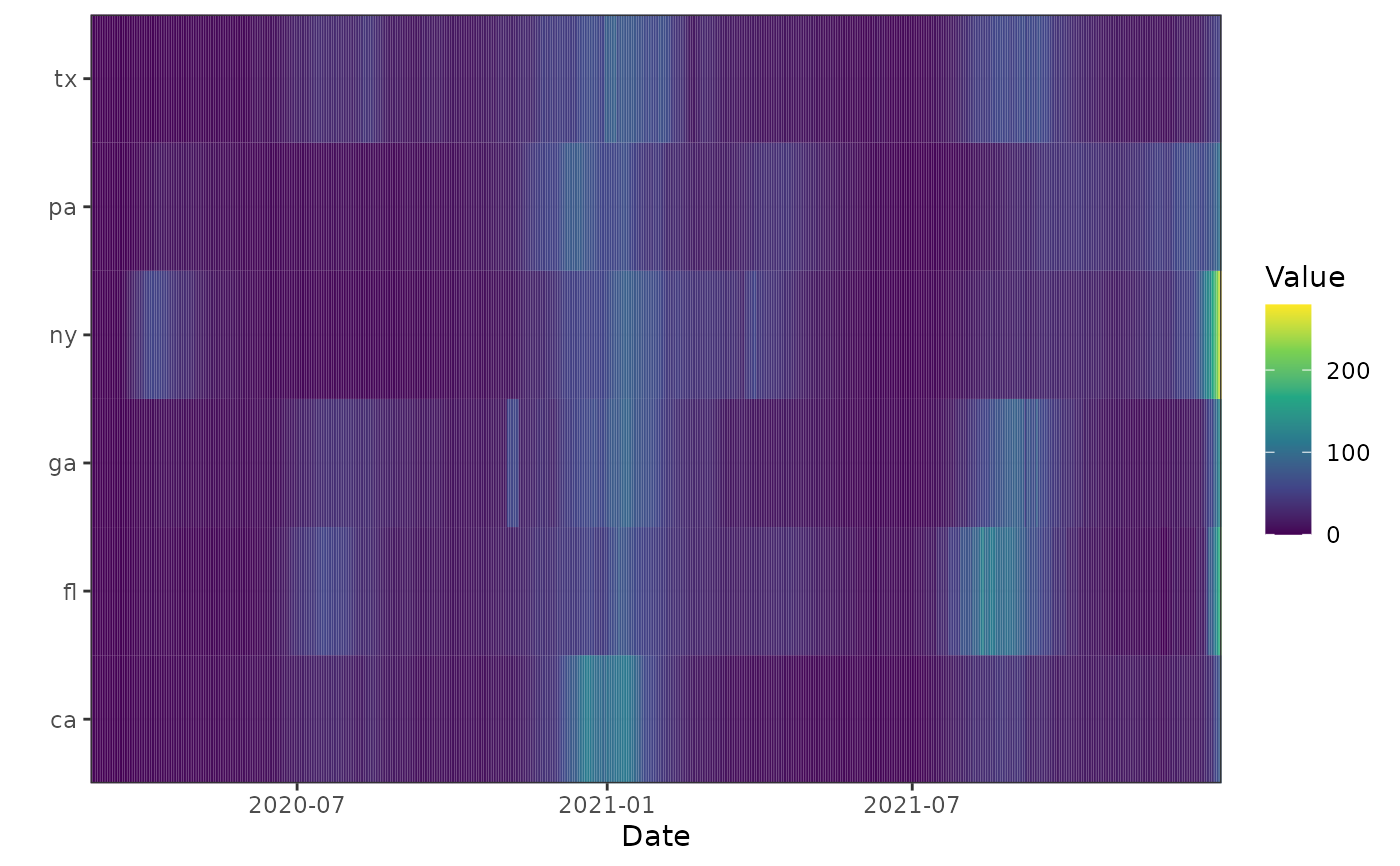
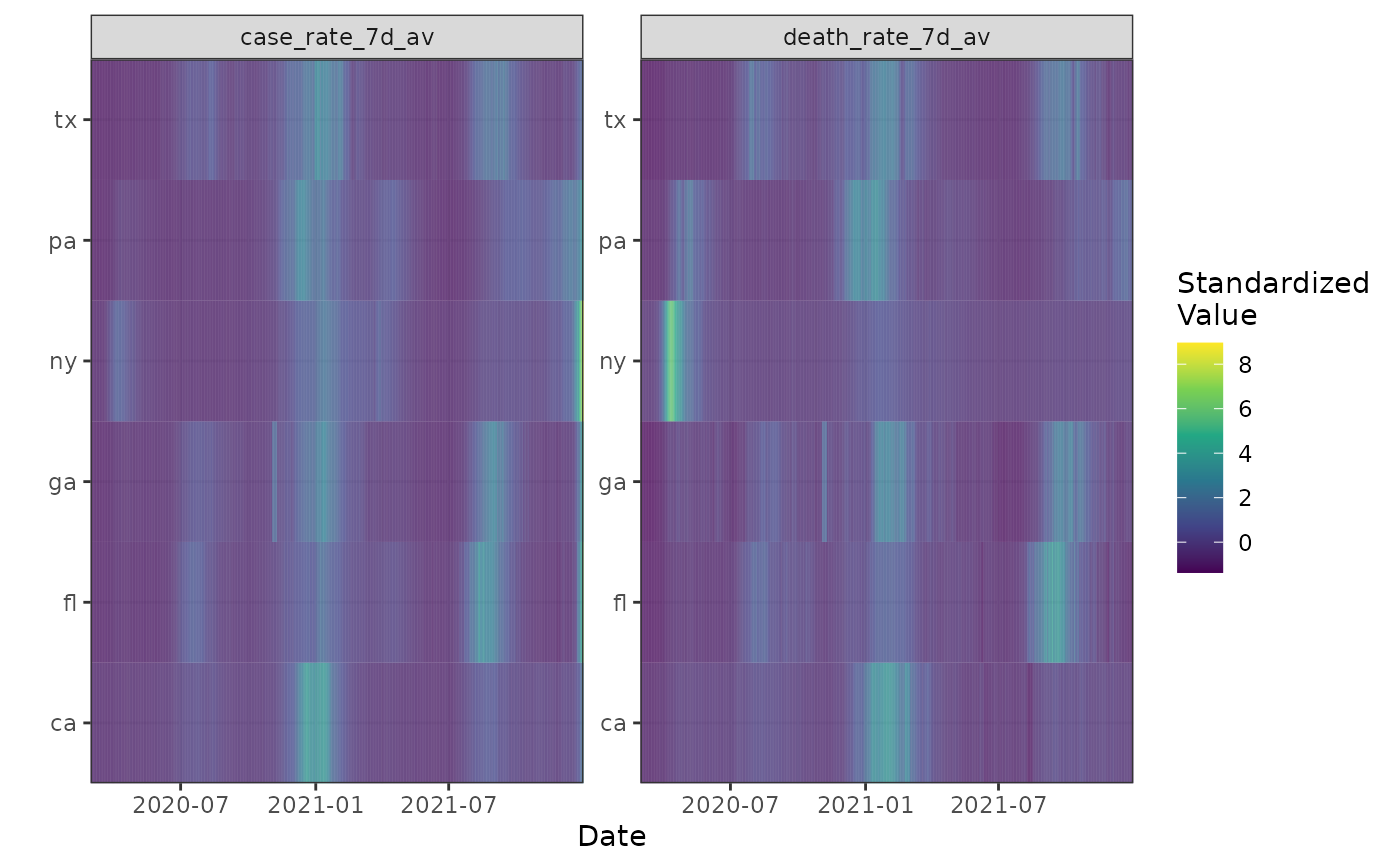
Plot a heatmap for an epi_df
Arguments
- x
An
epi_dfobject.- ...
<
tidy-select> One or more unquoted expressions separated by commas. Variable names can be used as if they were positions in the data frame, so expressions likex:ycan be used to select a range of variables.- .max_keys
The maximum number of key combinations to display.
Value
A ggplot2::ggplot object.