National Syndromic Surveillance Program Emergency Department Visits
| Attribute | Details |
|---|---|
| Source Name | nssp |
| Data Source | The National Syndromic Surveillance Program (NSSP) |
| Geographic Levels | National, Department of Health & Human Services (HHS) Regions, State (see geography coding docs) |
| Temporal Granularity | Weekly (see date format docs) |
| Reporting Cadence | Weekly |
| Date of last data revision: | Never (see data revision docs) |
| Temporal Scope Start | 2022-10-01 |
| License | Public Domain US Government |
Changelog
Click to expand
See COVIDcast Signal Changes for general information about how we track changes to signals.
No changes so far.
Overview
The National Syndromic Surveillance Program (NSSP) is an effort to track epidemiologically relevant conditions. This dataset in particular tracks emergency department (ED) visits arising from a subset of influenza-like illnesses, specifically influenza, COVID-19, and respiratory syncytial virus (RSV). It is derived from the CDC’s Respiratory Virus Response NSSP Emergency Department Visit Trajectories dataset, which started reporting data in late 2022. As of May 2024, NSSP received data from 78% of US EDs.
Available Signals
- Raw Signals (prefix
pct_ed_visits_) represent the weekly percentage of ED visits associated with a specific pathogen. - Smoothed Signals (prefix
smoothed_pct_ed_visits_) represent a 3-week moving average of the raw signal.
| Signal Pair (Raw / Smoothed) | Pathogen | Description | |
|---|---|---|---|
pct_ed_visits_covidsmoothed_pct_ed_visits_covid |
COVID-19 | Percentage of ED visits with a discharge diagnosis of COVID-19. | |
pct_ed_visits_influenzasmoothed_pct_ed_visits_influenza |
Influenza | Percentage of ED visits with a discharge diagnosis of Influenza. | |
pct_ed_visits_rsvsmoothed_pct_ed_visits_rsv |
RSV | Percentage of ED visits with a discharge diagnosis of RSV. | |
pct_ed_visits_combinedsmoothed_pct_ed_visits_combined |
Combined | Percentage of ED visits with a diagnosis of any of the above (COVID, Flu, or RSV). |
Table of Contents
Estimation
The percent visits signals are calculated as a fraction of visits at facilities reporting to NSSP, rather than all facilities in the area.
NSSP publishes this data based on reporting facilities aggregated to the level of Health Service Areas (HSAs, which are clusters of adjacent counties).
NSSP also publishes these percentages aggregated to state and nation levels.
While NSSP also publishes what appears like county-level data, these values are actually inherited from the parent HSA, such that all counties in an HSA have identical values.
Delphi publishes NSSP’s reported values for all these geo-levels, and also calculates and publishes values for HRRs and MSAs (based on the approximated county values), as well as for HHS regions.”
Geographic weighting
As the original data is a percentage and raw case counts are not available, hrr,msa, and hhs values are computed from county-level data using a weighted mean. Each county is assigned a weight equal to its population in the last census (2020). Unreported counties are implicitly treated as having a weight of 0 or a value equal to the group mean.
This weighting approach assumes that the number of ED visits is proportional to the overall population of a county, i.e. the per-capita ED visit rate is the same for all counties, which may not be the case (for example, denser counties may have easier access to EDs and thus higher rates of ED visits per capita).
State reporting process is separate from the county reporting process. As such, state-level data is not simply an average of the county-level data, but may contain facilities omitted at the regional level. For example, state-level values are available for California, even though no California county data is reported; see the missingness section below for a list of such states.
Smoothing
Smoothed signals are calculated using a simple 3 week moving average of the relevant weekly signals. Note that since the unsmoothed pct_ed_visits_* signals report weekly data, each smoothed signal value is computed from 3 points rather than 21, as would be used if the unsmoothed data were reported daily.
Missingness
As of May 2024, NSSP received data from 78% of US EDs.
The NSSP site participation map shows counties containing at least one reporting ED between January 2023 and April 2024. California, Colorado, Missouri, Oklahoma, and Virginia have the most noticeable gaps in coverage, with many counties in those states having either no eligible EDs or having no recently reported data in NSSP. However, most states have some counties that do not contain any reporting EDs.
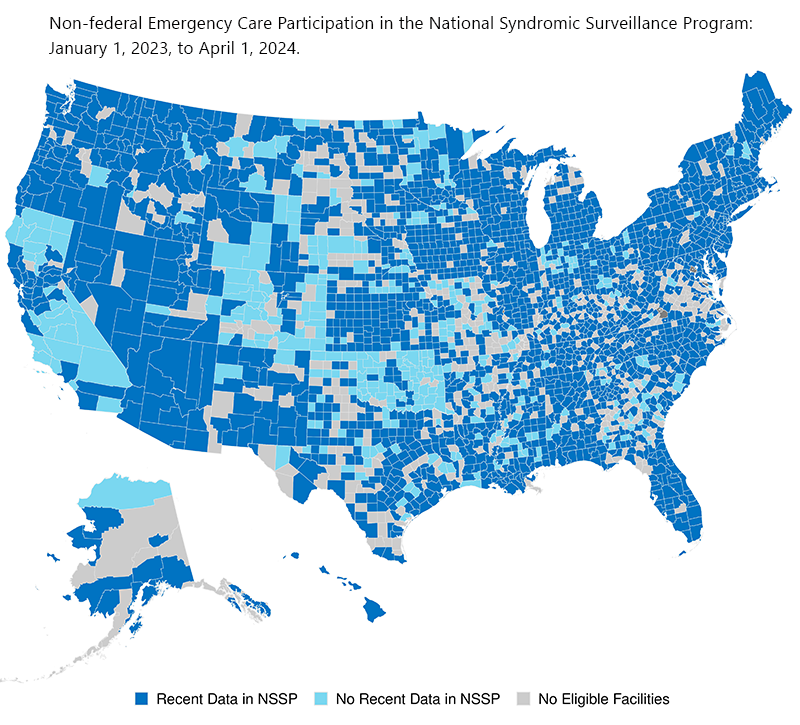
NSSP does not report county-level data for all counties with reporting EDs; some reporting EDs are only included in state-level values.
The following states report no data through NSSP at the county level: CA, WA, AK, AZ, AL, CO, SD, ND, MO, AR, FL, OH, NH, CT, NJ.
South Dakota, Missouri, and territories report no data through NSSP at the state level.
The only completely non-reporting state is Missouri.
Lag and Backfill
The weekly signal is reported on Friday mornings, adding data from the prior week. For example, on Friday, 2024-04-19, the source added new data from the week ending 2024-04-13.
This data source has frequent backfill, primarily arising from newly included EDs. When a new facility joins the reporting network, its historical data is added to the dataset, resulting in changes to historical values for every geographic level that ED is part of (county through nation). Because of this, the broadest geographic levels are more likely to be revised.
In previous revisions, we have noted changes to values dating back about 2 years.
The following states have no county-level data at all: AK, AL, AR, AZ, CA, FL, MO, ND, NH, NJ, OH, SD, WA.
Counties with NA values are as originally reported in the dataset from which this source is derived; this is not a complete list of counties, and reflects missing data as collected by the NSSP.
Limitations
As noted above, only state and HSA-level values are calculated and published by NSSP; County level values are not published individually, but are approximations copied from the HSA the county is in (every county in an HSA will have identical values). The HSA (Health Service Area) definitions used are known as “NCI Modified”.
There is substantial missingness at the county level. This tends to impact more rural and lower population locations. See the missingness section for more information.
Not all counties contain reporting EDs, including in states where NSSP reports state-level data. A minority of these (as of June 2024) are counties without EDs, while others are only covered by the ~22% of EDs that don’t yet report to the NSSP.
NSSP notes that not every patient entering an ED is tested for the conditions of interest, so the data may undercount total cases and as a result percent visits may be biased downward.
Our geographic weighting approach assumes that the number of ED visits is proportional to the overall population of a county. However, in reality, there are various factors that could affect the accuracy of this assumption.
For example, we might expect denser, more urban counties to have 1) more and larger EDs and 2) easier access to EDs. The first factor may mean that residents of rural counties are more likely to go to EDs in urban counties. The second factor may increase the total number of ED visits that the typical urban resident will make relative to the typical rural resident. As a result, total ED visits per capita in rural counties may be lower than total ED visits per capita in urban counties. If this is a strong dynamic, since our weighting approach uses population as the weights, rural counties would tend to be overrepresented in estimated values.
Some low population counties occasionally report outliers, e.g. 33.33%, 50%, 100% of ER visits being COVID-19-related. We expect that these high rates are by chance, due to a small total number of ED visits in a given week. As of May 2024, an analysis shows around 10 unusually high values across the full history of all signals, so they are rare.
Source and Licensing
This source is derived from the CDC’s Respiratory Virus Response NSSP Emergency Department Visit Trajectories dataset. There is another version of the dataset that includes state data only.
This data was originally published by the CDC, and is made available here as a convenience to the forecasting community under the terms of the original license, which is U.S. Government Public Domain.