Veterans Health Administration Seasonal Respiratory Surveillance
| Attribute | Details |
|---|---|
| Source Name | vha_respiratory_cases, vha_respiratory_vaccinations |
| Data Source | VHA Seasonal Disease Review |
| Geographic Levels | vha_catchment (cases only), state, msa (cases only), hhs, census_division, census_region, nation |
| Temporal Granularity | Daily, by reference date (season-to-date cumulative counts from Oct 1 to Sep 30) |
| Reporting Cadence | Daily |
| Temporal Scope Start | 2026-05-27 |
| Temporal Scope End | Ongoing |
| Extra Key Columns | None |
| License | Public Domain U.S. Government |
Table of contents
- Overview
- Indicators (Signals)
- Estimation
- Schema
- Missingness & Privacy
- Limitations
- Lag & Backfill
- Source and Licensing
Overview
The Veterans Health Administration (VHA) biosurveillance system tracks seasonal respiratory disease lab-confirmed cases and vaccinations across VHA medical facilities. Data is reported through the VHA Access to Care portal for three key respiratory diseases: COVID-19, Influenza, and RSV.
In the Delphi V5 API, this surveillance is published as two independent data sources:
vha_respiratory_casescontains daily catchment-level cumulative lab-confirmed case counts and derived 7-day average daily reported case rates.vha_respiratory_vaccinationscontains daily state-level cumulative doses administered and cumulative vaccination rates.
Indicators (Signals)
Cases (vha_respiratory_cases)
Case indicators reflect cumulative counts and population-adjusted daily reported case rates among Veterans Health Administration (VHA) enrollees:
| Indicator Name | Pathogen or Disease | Metric Type | Description |
|---|---|---|---|
covid_cases_cumulative |
COVID-19 | Cumulative count | Season-to-date lab-confirmed cases across VHA facility catchments. |
covid_cases_per_100k_7dav |
COVID-19 | Rate (7-day average) | 7-day trailing average of daily newly reported lab-confirmed cases (derived from cumulative snapshot differences) per 100,000 VHA-enrolled veterans. Includes 90% Wilson confidence intervals (ci_lower, ci_upper). |
flu_cases_cumulative |
Influenza | Cumulative count | Season-to-date lab-confirmed cases across VHA facility catchments. |
flu_cases_per_100k_7dav |
Influenza | Rate (7-day average) | 7-day trailing average of daily newly reported lab-confirmed cases (derived from cumulative snapshot differences) per 100,000 VHA-enrolled veterans. Includes 90% Wilson confidence intervals (ci_lower, ci_upper). |
rsv_cases_cumulative |
RSV | Cumulative count | Season-to-date lab-confirmed cases across VHA facility catchments. |
rsv_cases_per_100k_7dav |
RSV | Rate (7-day average) | 7-day trailing average of daily newly reported lab-confirmed cases (derived from cumulative snapshot differences) per 100,000 VHA-enrolled veterans. Includes 90% Wilson confidence intervals (ci_lower, ci_upper). |
Vaccinations (vha_respiratory_vaccinations)
Vaccination indicators track season cumulative uptake across all three pathogens, plus lifetime cumulative uptake for RSV:
| Indicator Name | Pathogen or Disease | Metric Type | Description |
|---|---|---|---|
covid_vaccines_season_cumulative |
COVID-19 | Cumulative count | Season-to-date doses administered to VHA enrollees (see Season Rollover). |
covid_vaccines_season_cumulative_per_100k |
COVID-19 | Cumulative rate | Season-to-date doses per 100,000 VHA enrollees with 90% Wilson confidence intervals (ci_lower, ci_upper). |
flu_vaccines_season_cumulative |
Influenza | Cumulative count | Season-to-date doses administered to VHA enrollees (see Season Rollover). |
flu_vaccines_season_cumulative_per_100k |
Influenza | Cumulative rate | Season-to-date doses per 100,000 VHA enrollees with 90% Wilson confidence intervals (ci_lower, ci_upper). |
rsv_vaccines_season_cumulative |
RSV | Cumulative count | Season-to-date doses administered to VHA enrollees (see Season Rollover). |
rsv_vaccines_season_cumulative_per_100k |
RSV | Cumulative rate | Season-to-date doses per 100,000 VHA enrollees with 90% Wilson confidence intervals (ci_lower, ci_upper). |
rsv_vaccines_lifetime_cumulative |
RSV | Cumulative count | Total cumulative doses administered since tracking began. |
rsv_vaccines_lifetime_cumulative_per_100k |
RSV | Cumulative rate | Lifetime cumulative doses per 100,000 VHA enrollees with 90% Wilson confidence intervals (ci_lower, ci_upper). |
Estimation
Metric Definition
Counts are normalized by VHA enrollment rather than the general veteran population to compute rates per 100,000 enrolled veterans using official county-level statistics from the VHA Enrollees by County dataset:
\[\text{rate\_per\_100k} = \frac{\text{count}}{\text{enrollees}} \times 100{,}000\]For cases, daily newly reported lab-confirmed cases (\(\Delta C_t\)) are derived as the difference between successive cumulative snapshots:
\[\Delta C_t = C_t - C_{t-1}\]Differences vs. True Epidemiological Incidence: Daily differences (\(\Delta C_t\)) represent newly reported lab-confirmed cases between consecutive portal snapshots rather than true disease incidence (date of illness onset or infection). Differences reflect administrative reporting flow, batching, and system updates rather than the exact timing of clinical onset.
Vaccinations are reported strictly as cumulative metrics (season cumulative or lifetime cumulative) and are not differenced into daily counts.
Smoothing
To smooth noise from weekend reporting and administrative batching, Delphi applies a 7-day trailing moving average (_7dav) to daily newly reported lab-confirmed cases (\(\Delta C_t\)) before calculating the per-100,000 rate.
Deflation Guard (Cases Only)
Raw cumulative counts from the VHA portal occasionally decrease due to reporting delays, downward revisions, or transitions into censored status (< 11).
For derived daily case differences and smoothed rates, Delphi applies a deflation guard for single-day anomalies: when a negative daily delta (\(\Delta C_t < 0\)) is offset by an immediate next-day recovery (\(\Delta C_t + \Delta C_{t+1} \ge 0\)), the guard zeroes day $t$ and folds the difference into day $t+1$. Multi-day dips or drops without an immediate recovery pass into the 7-day moving average, which can produce negative rates (*_cases_per_100k_7dav) where confidence intervals are omitted (null).
Cumulative indicators publish raw snapshots without modification. Vaccinations are published only as cumulative metrics and do not use a deflation guard.
Uncertainty
Rate signals include uncertainty estimates quantified using the 90% Wilson score interval (\(z = 1.645\)), published directly in the ci_lower and ci_upper columns:
where \(\hat{p} = \frac{\text{count}}{n}\) and \(n\) is the enrolled veteran population for the geographic area. Rate values and confidence bounds are rounded to 4 decimal places. If a rate value is negative (due to an unabsorbed cumulative snapshot drop), the Wilson confidence interval is undefined and emitted as null.
Temporal Handling
Observations are referenced daily by observation date (YYYY-MM-DD), parsed from the scraped file prefix:
- Surveillance seasons run October 1 through September 30.
reference_timerepresents the observation date.report_timeis the UTC date when Delphi processed the snapshot.- The upstream portal overwrites files under the same name and retains approximately one month of history. To avoid redundant uploads during intra-day oscillations, the ingestion pipeline stores a new file only if its content differs from the last 4 stored versions for that date.
Season Rollover
Surveillance seasons run from October 1 through September 30, but upstream reporting around October 1 behaves differently for vaccines and cases.
As of October 2026, the upstream portal did not reset ThisSeasonCount to zero at the start of the season. Because of this, seasonal cumulative vaccine indicators continue accumulating across seasons rather than restarting from zero.
For cases, daily rates are derived from changes in cumulative counts. The pipeline assumes cumulative totals reset to zero on October 1. If the VHA portal delays its reset by a day, the prior season’s cumulative total is treated as new lab-confirmed cases on October 1, followed by a sharp drop when the portal resets on October 2. This can distort 7-day average rates during the first week of October.
Geographic Handling
The Veterans Health Administration (VHA) provides care through regional Healthcare Systems (HCS) and Medical Centers (VAMC). Because patient draw areas follow healthcare delivery patterns rather than political boundaries, facility service areas often span across state lines:
- Cases (
vha_respiratory_cases): Reported natively at the VHA catchment (vha_catchment) level across 139 facility catchments nationwide. Catchment lab-confirmed case counts are disaggregated to constituent counties using veteran enrollee population weights from the VHA Enrollees by County dataset, then re-aggregated up through Delphi’s standard geographic crosswalk tostate,msa,hhs,census_division,census_region, andnation. Raw county counts are not published. - Vaccinations (
vha_respiratory_vaccinations): Reported natively at the state level (state). These aggregate upward directly tohhs,census_division,census_region, andnationusing enrollee population weights. Non-US entries (phfor the Philippines andother) are excluded during aggregation.
Understanding vha_catchment Geographic Levels
VHA healthcare facility catchment areas do not align with state lines. Medical centers frequently draw patients from surrounding counties in neighboring states. Grouping facilities directly by their home state would produce irregular territories that deviate from state borders. To prevent this, Delphi disaggregates facility counts to constituent counties using enrollee weights before aggregating them to standard geographic levels like states and HHS regions.
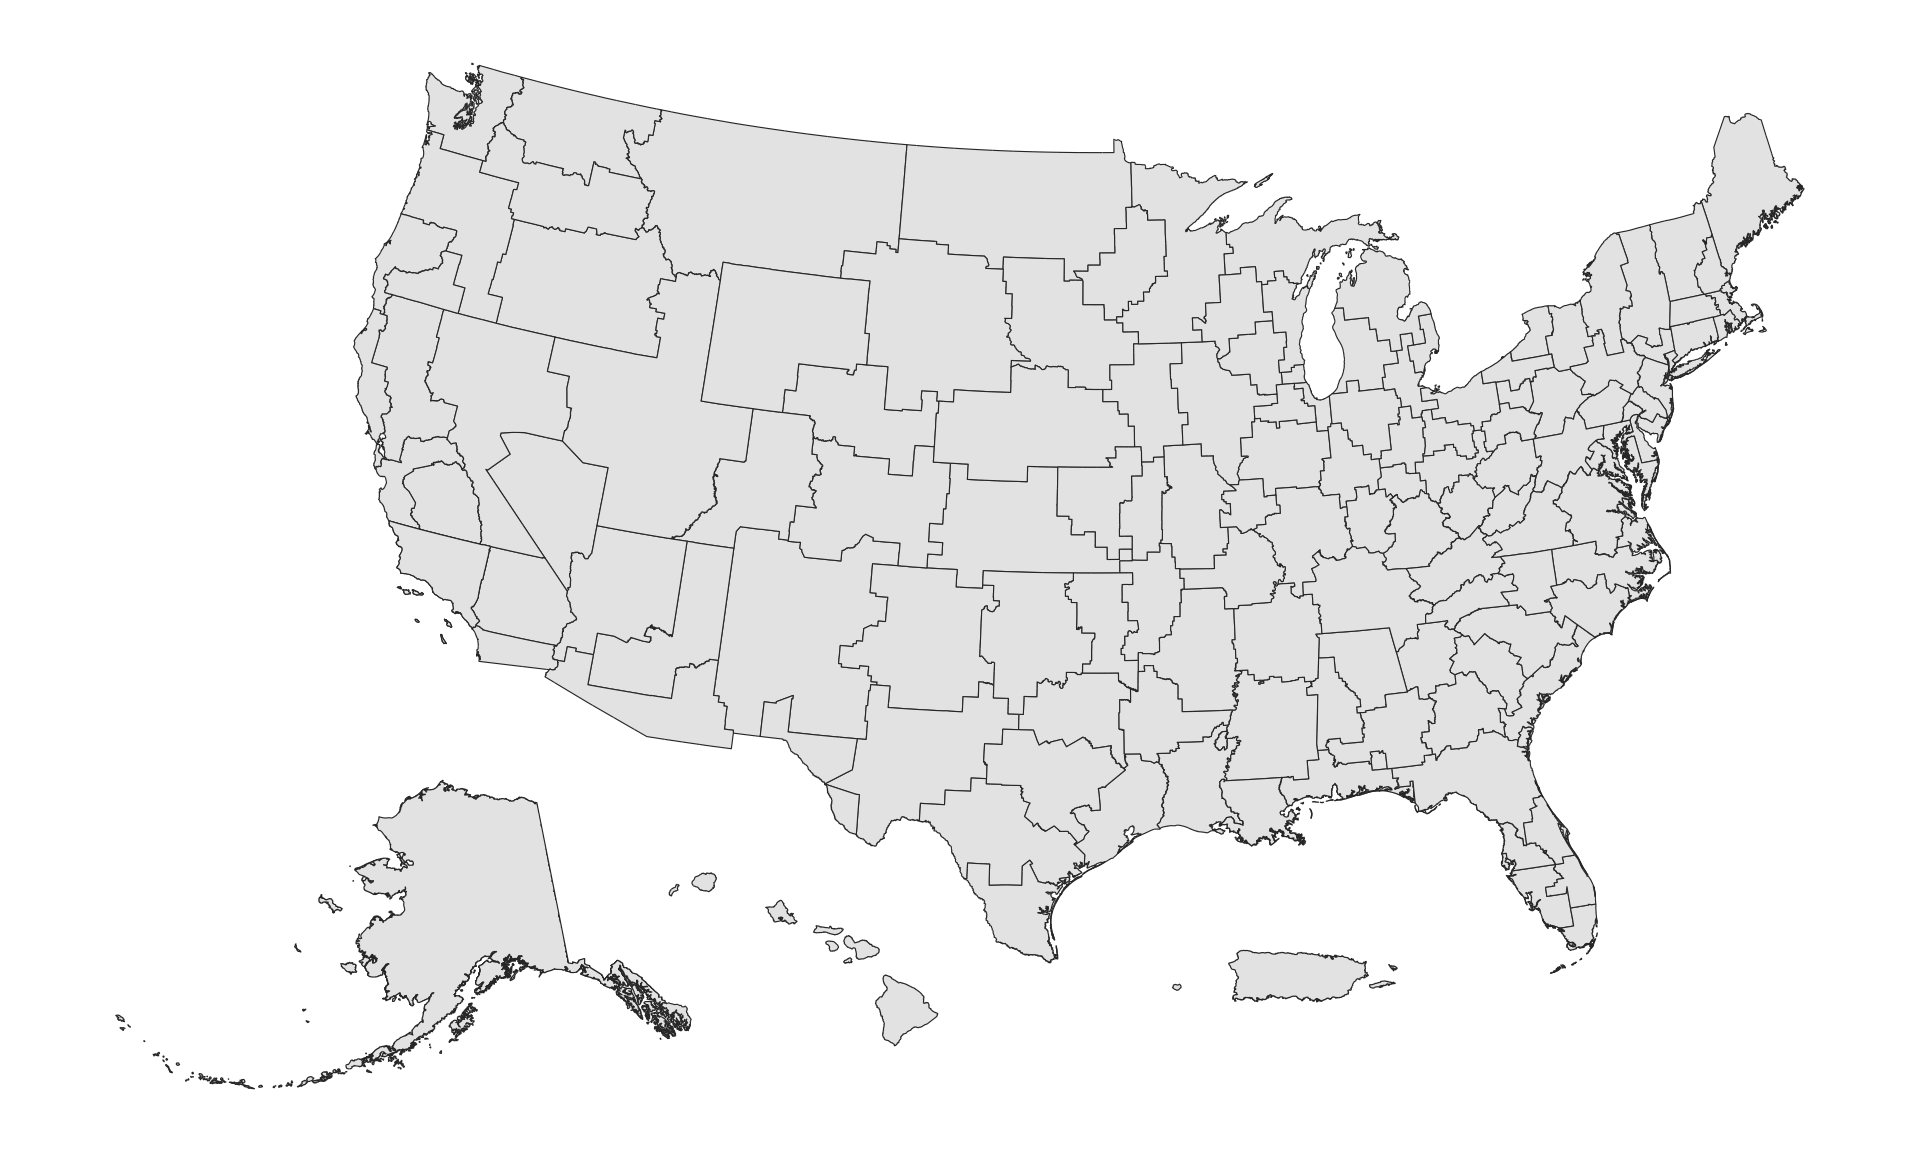 Reconstructed catchment boundaries for all 139 VHA healthcare facilities across the United States. Non-contiguous states and territories (Alaska, Hawaii, and Puerto Rico) are displayed in shifted inset positions.
Imputation and fill_method
source: Native reported grain (vha_catchmentfor cases,statefor vaccinations) without spatial imputation.ave: Derived geographic roll-ups where missing child locations take the enrollee-weighted average of reporting locations.- Cumulative totals for higher-level geographies are withheld if any underlying location is entirely missing from that day’s source file.
Schema
Columns
| Column | Key Type | Data Type | Description |
|---|---|---|---|
signal |
Primary Key | string | Name of the indicator (e.g. covid_cases_per_100k_7dav, rsv_vaccines_season_cumulative). |
report_time |
Primary Key | date | The date Delphi ingested the snapshot (YYYY-MM-DD). |
geo_type |
Primary Key | string | Geographic level (vha_catchment, state, msa, hhs, census_division, census_region, nation). |
geo_value |
Primary Key | string | Location identifier (e.g. catchment name, 2-letter state abbreviation, census code). |
fill_method |
Primary Key | string | Imputation method used during geographic aggregation (source or ave). |
reference_time |
Primary Key | date | Observation date (YYYY-MM-DD). |
value |
Value Column | float | Estimated signal value (cumulative count, 7-day average rate, or cumulative rate per 100,000 enrollees). |
ci_lower |
Value Column | float | Lower bound of the 90% Wilson confidence interval (rate signals only). |
ci_upper |
Value Column | float | Upper bound of the 90% Wilson confidence interval (rate signals only). |
Missingness & Privacy
Counts fewer than 11 are suppressed upstream by the VHA for patient privacy and reported as < 11. In Delphi’s pipeline, censored values are imputed as 5 (the midpoint of 0 to 10) to facilitate cumulative tracking and difference calculations. Any other non-numeric text is parsed as null.
In the Delphi API, calculated zero daily rate deltas and zero rates are published explicitly as 0, whereas missing observations or withheld aggregates are emitted as null (or omitted rows).
Higher-level cumulative totals (state, MSA, HHS region, Census division, Census region, and nation) are published only when all underlying child locations report for a given reference date. If any expected facility or location is entirely absent from that day’s source file, the aggregate cumulative count is withheld.
Limitations
- Enrolled veterans are predominantly older and male compared to the general population, so rates may not reflect broader community transmission.
- Lab-confirmed cases reflect the date of laboratory confirmation rather than symptom onset. Daily snapshot differences capture administrative reporting cadence rather than true disease incidence.
- Cumulative counts can decrease due to upstream revisions or transitions to censored status (
< 11). Cumulative signals publish these raw values directly. Dips that do not recover the following day can produce negative 7-day average case rates with omitted confidence intervals. - As of October 2026, seasonal vaccine counts did not reset to zero on October 1 and continue accumulating across seasons.
- A delay in the portal’s case reset around October 1 can cause a brief spike followed by a drop in early October rates.
Lag & Backfill
VHA files are published daily by the VHA Access to Care portal and ingested same-day by Delphi (0 days nominal reporting lag). Because the portal only retains files for approximately 30 days, retrospective backfilling is limited to that window.
Source and Licensing
Data originates from the Veterans Health Administration Access to Care Seasonal Disease Review.
This public dataset is in the public domain as a work of the United States Government under 17 U.S.C. § 105.